Back
StockInsightEngine
Year
2024
Tech & Technique
Python, Streamlit, Plotly, Pandas, NumPy, SQLAlchemy, yFinance API
Description
StockInsightEngine is an interactive market analysis platform that allows users to explore a stock's performance, fundamentals, and risk profile in a single, streamlined interface. The goal was to create a central workspace where investors can move from raw price data to actionable insight without switching between multiple tools.
Problem
Most beginner and intermediate investors analyze stocks using separate platforms for charts, financial summaries, and return calculations. This fragmentation makes it difficult to understand real performance behavior, compare stocks meaningfully, and build confidence in investment decisions. There was a need for a unified, interpretable, and data-driven analysis experience.
Solution
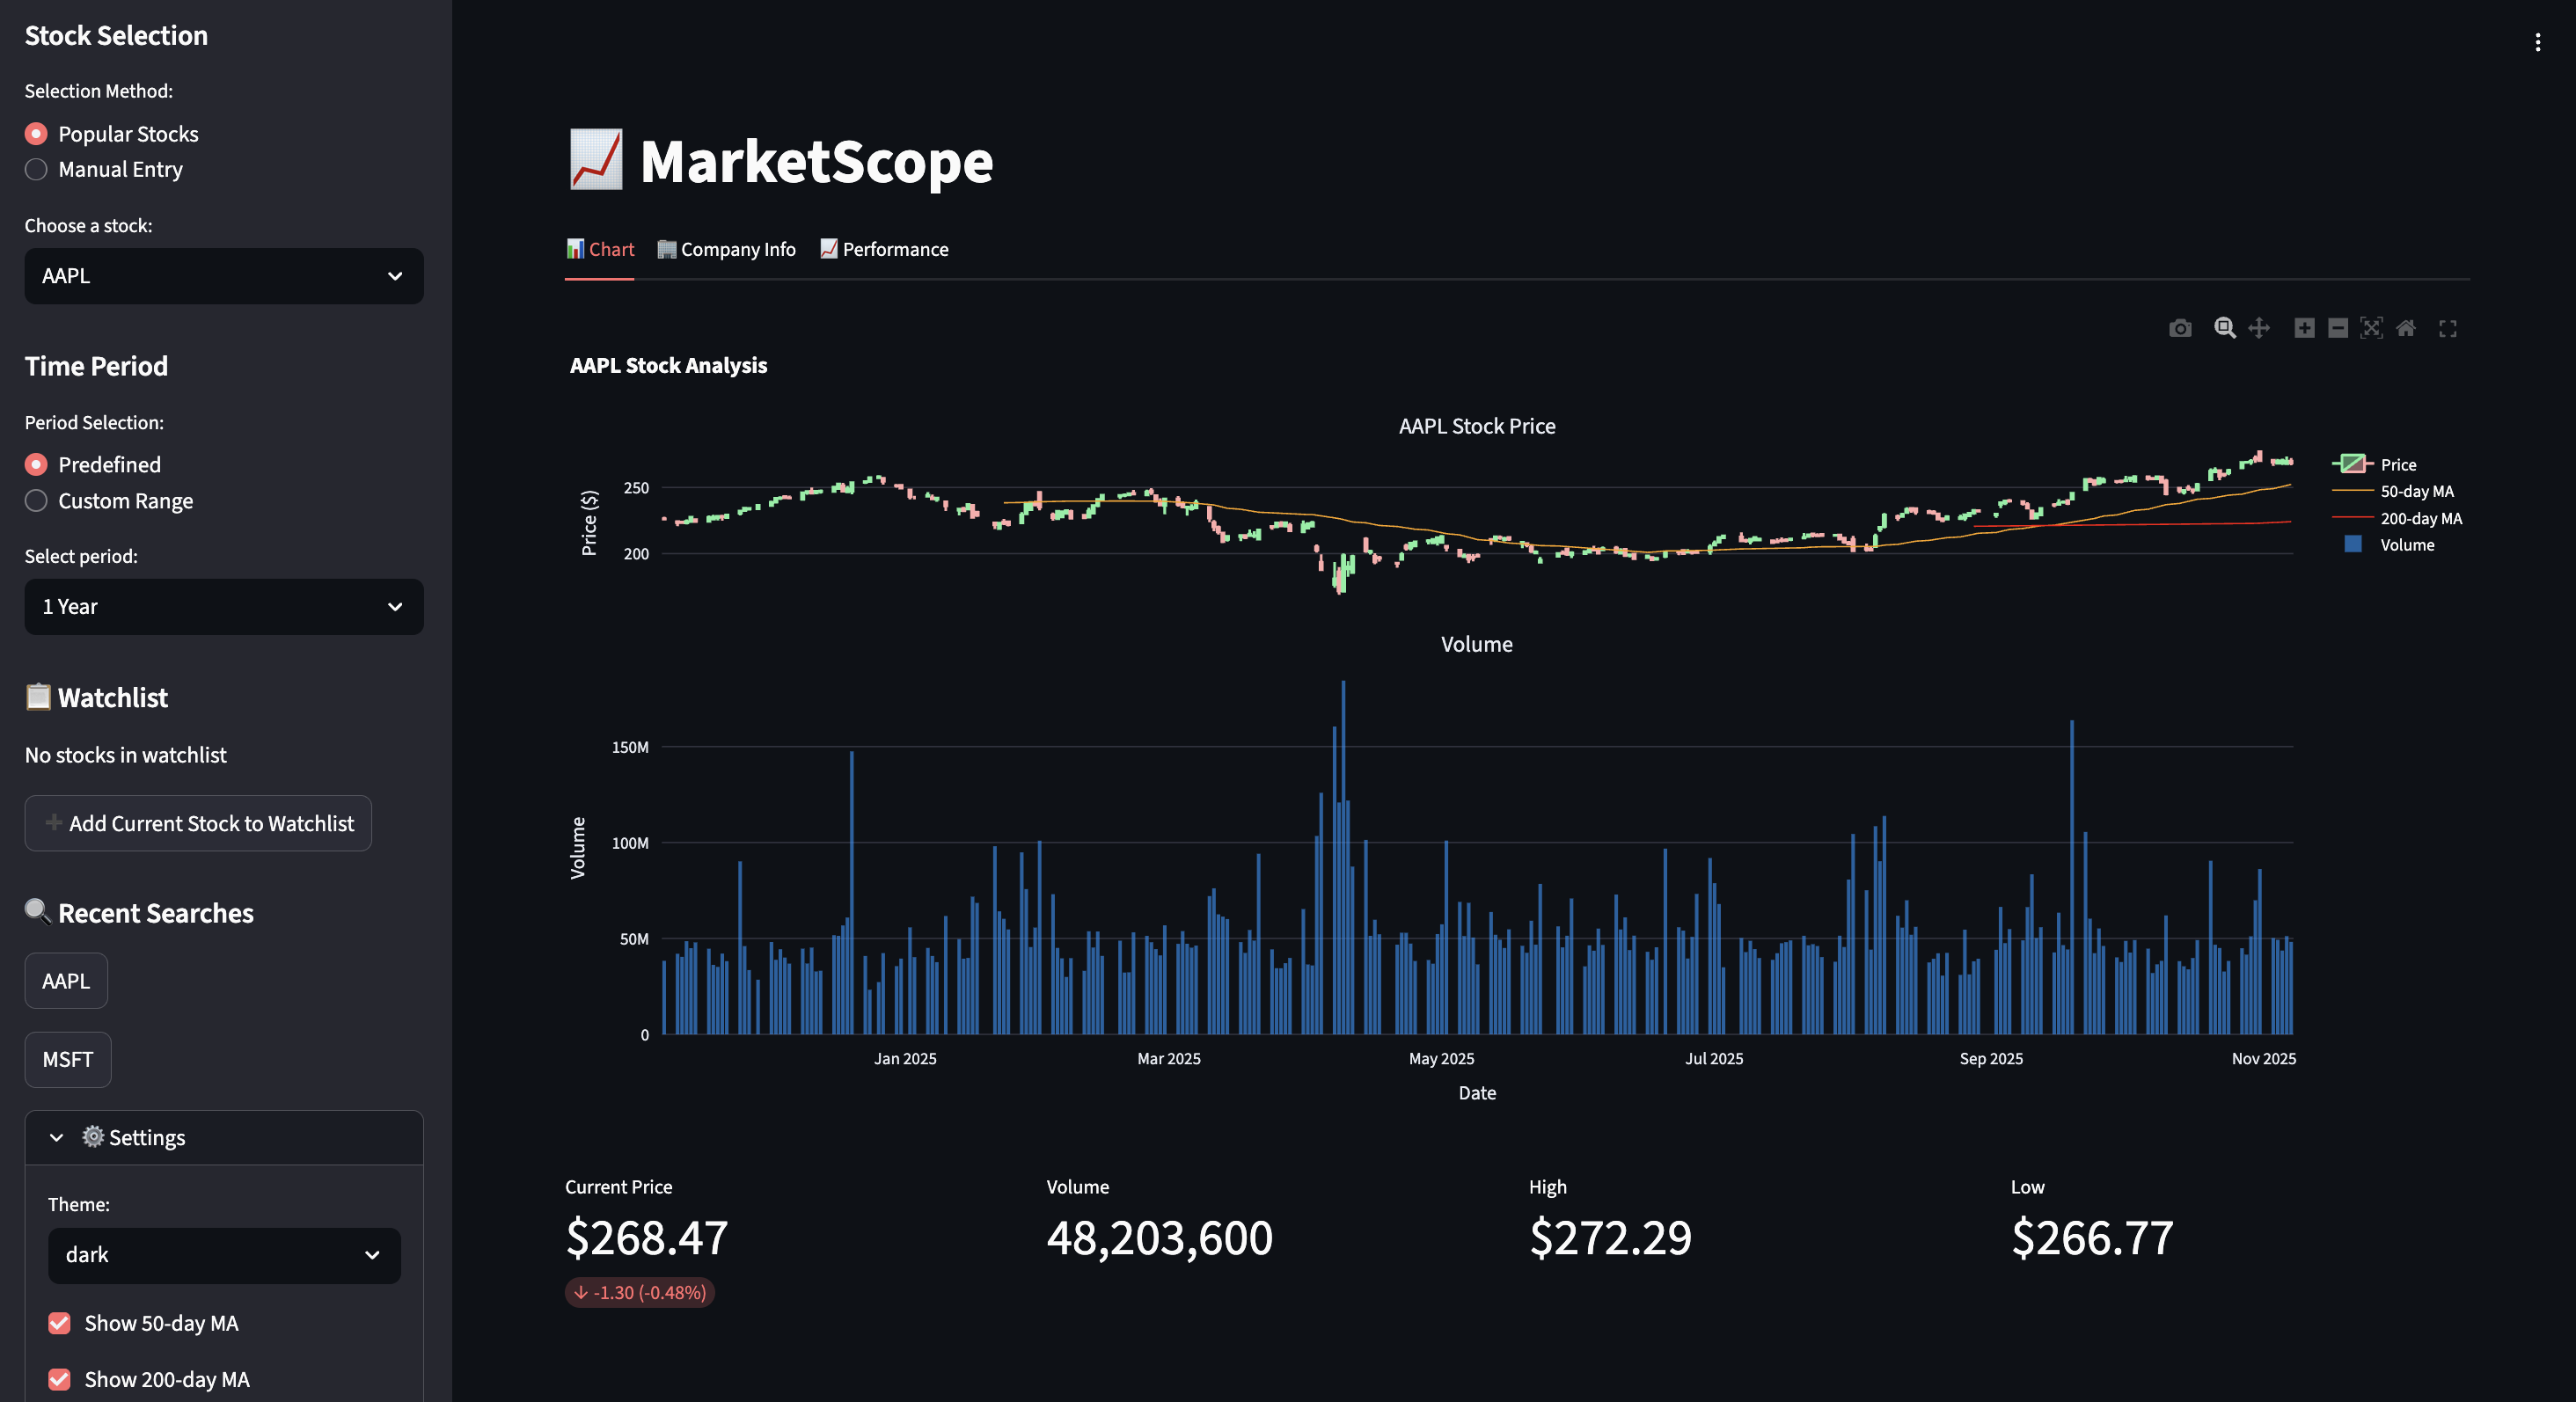
I designed and developed a real-time stock insight platform that combines interactive charting (candlesticks, volume overlays), technical indicators (moving averages), return & risk analysis (volatility, Sharpe ratio), company financial context, and watchlists with preference storage. All features are displayed in a single analysis workflow, improving clarity and decision efficiency.
Core Capabilities:
Impact
The platform allows users to move from raw data → interpretation → personal tracking in one interface, reducing research time and improving clarity when evaluating stocks. The experience encourages evidence-based decision making rather than emotional or momentum-driven choices.
Problem
Most beginner and intermediate investors analyze stocks using separate platforms for charts, financial summaries, and return calculations. This fragmentation makes it difficult to understand real performance behavior, compare stocks meaningfully, and build confidence in investment decisions. There was a need for a unified, interpretable, and data-driven analysis experience.
Solution
I designed and developed a real-time stock insight platform that combines interactive charting (candlesticks, volume overlays), technical indicators (moving averages), return & risk analysis (volatility, Sharpe ratio), company financial context, and watchlists with preference storage. All features are displayed in a single analysis workflow, improving clarity and decision efficiency.
Core Capabilities:
- 📈 Live Price Data: Real-time and historical performance data via yFinance
- 📊 Interactive Visualizations: Candlestick + volume charts with Plotly
- 📉 Technical Indicators: 50-day and 200-day moving average overlays
- 🎯 Risk Analysis: Return and volatility calculations with Pandas/NumPy
- 💼 Financial Metrics: Company overview and key financial data
- ⭐ Persistent Storage: Watchlist and recent search tracking with SQLite + SQLAlchemy
- 📱 Responsive Design: Light/Dark theme and adaptive layout for usability
Impact
The platform allows users to move from raw data → interpretation → personal tracking in one interface, reducing research time and improving clarity when evaluating stocks. The experience encourages evidence-based decision making rather than emotional or momentum-driven choices.
My Role
Data Analyst & Developer